The best articles ever written about ASL are a series of articles written by Robert Medrow. These First Impressions articles appeared in The General magazine and delved into the mathematics of ASL. They are the first articles listed in the Resources section of my blog. They were among the first to look at ASL from a mathematical perspective. I cannot recommend them enough.
Unfortunately, these articles are very dense. They can be a little tough to read, especially for new players or those who aren’t fascinated by mathematics like I am. My friend Mike Balis asked me to summarize Medrow’s second article on Armor Training. Mike has done so much to help me with my blog that I didn’t hesitate to return the favor. I hope this helps Mike.
How To Use This Article

One of the biggest points Medrow makes is when and where to use this information. Medrow suggests this information is part of pre-game preparation and not for usage during play. His reasoning is that constantly referring to the tables during play would slow the pace of play. I couldn’t agree more.
As you go through this article and get to see some tables, use the information in your pre-game routine to determine which engagement opportunities favor your armored vehicles over your opponents. Please don’t whip these tables out to check the odds with each hex moved.
My goal here is to define some common “rules of thumb” that help you engage the enemy under favorable conditions.
Assumptions
For his article, Medrow assumed Immobilization and Shock constituted a “mission kill”. This may not always be the case but by doing this, he simplified the discussion. Recall that Immobilization occurs on a Hull Hit and when the Final TK DR equals the Final TK#.
Finally, Medrow ignores the effects of Duds and Possible Shock as this simplifies the calculations. If this bothers you, ignore the 12 TK row and use the 11 TK row for any Modified TK# ≥ 11. I will leave the effect of Possible Shock up to you but it isn’t a very large possibility. Medrow does not account for Acquisition either.
Effects Of Medrow’s Assumptions

Medrow’s tables will be slightly more deadly than in actual use. An Immobilized tank can still attack enemy units in its LOS. It can still fire SMOKE to cover the approach. Its usability might be limited if it is out of the way, but if it’s right where it wants to be, it could remain fully capable of performing its mission.
A Shocked vehicle may recover over the next two player turns. A vehicle that recovers is 100% of what it was before Shocked, and mathematically, it recovers 66% of the time. While I won’t label this as a Rule of Thumb, it is well worth your time to destroy Shocked Enemy AFVs. Eliminated AFV do not return. Possibly Shocked AFV may.
Still, for the purposes of Medrow’s article, these assumptions are not bad ones to make. The odds of these happening are slight and discounting them simplifies the discussion.

Using Medrow’s Table 13
IMO, table 13 is the most useful table in the article but it does need a little explanation. According to the note, the table is determined for a Basic To Kill (TK#) of 6. Does this mean the table is useless in all other circumstances? Far from it. Medrow makes this assumption due to the resolution of Critical Hits. For the general purpose case, it is safe to ignore this as the real answer is within 1% of the value listed in the table.
To use the table, first determine what Original TH Die Roll (DR) is needed to hit the target. Once you have the Original TH DR needed, next determine the Original TK DR needed. Finally, cross index the Original TH# needed (across the top) with the Final TK# (along the left). Where these intersect on the left table, you have the probability of a Kill against the turret. Access the table on the right similarly and you have the probability of a Kill against the hull. Adding these two sums together gives you the chance of eliminating the target.
Medrow’s Table 13 Example

Assume the PzIV shoots on the Sherman during the Sherman’s MPh. The Sherman has entered a new Location and is a Moving Vehicular Target. The Basic TH# is 10. There is a +1 Case I DRM. There is a +2 Case J and a -1 Case P DRM. The Final is a Basic TH# of 10 with a +2 DRM. To hit, the PzIV needs an Original TH DR ≤ 8.
The PzIV’s Basic TK# is 17. There are no modifiers so the Modified TK# is 17. If the PzIV hits the Sherman in the turret, the Armor Factor is 8. If the PzIV hits in the hull, the hull Armor Factor is 4 (side aspect). The Modified TK# for the PzIV is a 9 for a turret hit and a 13 for a hull hit.
Looking at the table on the left, an Original TH DR of 8 against a Modified TK# of 9 yields a 23.4% chance to kill on a turret hit. Cross indexing an Original TH DR of 8 with a Modified TK# of 12 (you can’t roll more than 12 on 2 dice) yields a 43.4% chance to eliminate on a hull hit. Adding these both together, the PzIV has a 66.8% chance to eliminate the Sherman accepting all the assumptions noted above.
Digging Deeper
Against the side of the Sherman, nearly any hit will eliminate it. The only thing saving the Sherman from destruction would be a Dud (C7.35). The Sherman’s best defense is to make the PzIV miss its shot. Exposing the side of the Sherman should only be done when the odds of hitting the Sherman are marginal. Even frontally, the PzIV’s Final TK# of 9 eliminates the Sherman 83.33% of the time it gets hit.
Looking for a more generic rule then, when a hit is near certain elimination, your best chances of survival is to round up as many TH DRM as possible, reducing the chances of being hit. I doubt this is a revelation to most ASL players. What might be a little counterintuitive is not all Original TH DRs are the same.
Odds Of Rolling Less Than Or Equal To a DR On Two Dice
| Chances To Roll ≤ On Two Dice | |||
| ROLL A… | PROBABILITY | Change When Increasing DR | Change when Decreasing DR |
| 2 | 1/36 (2.778%) | 2.778% | |
| 3 | 3/36 (8.333%) | 8.337% | 5.555% |
| 4 | 6/36 (16.667%) | 11.11% | 8.337% |
| 5 | 10/36 (27.778%) | 13.883% | 11.11% |
| 6 | 15/36 (41.667%) | 16.667% | 13.887% |
| 7 | 21/36 (58.333%) | 13.887% | 16.667% |
| 8 | 26/36 (72.222%) | 11.11% | 13.887% |
| 9 | 30/36 (83.333%) | 8.337% | 11.11% |
| 10 | 33/36 (91.667%) | 5.555% | 8.837% |
| 11 | 35/36 (97.222%) | 2.778% | 5.55% |
| 12 | 36/36 (100%) | 2.778% |
The leftmost column represents all the possible outcomes of a throw of 2 dice. The middle column represents the chance of rolling ≤ the total in the leftmost column. The next the effect of a +1 DRM. Finally, the rightmost column is the effect of a -1 DRM. So the effect of a +1 DRM moving an Original DR 12 to a Final DR 11 is only 2.78%. The effect of a +1 DRM between an Original DR 7 to a Final DR 6 is 16.67, slightly greater than 6 times as effective!
Examining the table then, DRMs in the middle of the table have the greatest impact. Against an opponent using Red TH numbers, simply being at range 7 shifts his TH#s from 10 to 8, a 19.44% shift in your favor. If the opponent has to fire BU, that’s another pip in your favor. With BU and Red TH#s at range 7, your opponent is facing an original 7 TH while you are facing an original 8, 9 if your AFV is CE. That’s a 33.33% swing in your favor on the TH chances. The odds tilt even more in your favor at longer ranges if your Guns are L or LL.
An Initial Conclusion
Clearly, if you can get other DRM applied, the chances to successfully hit your AFV go down even further. Moving Vehicular Target? That’s a +2 TH DRM. Small target? That’s another +1. When a hit is almost certainly a kill, these TH DRM ARE your armor. Just remember, not all DRM are equal just as the table above shows. As a rule of thumb, the closer you are to 7, the more impactful the DRM is, tailing off to the ends. Around 4 TH–or 10 on the other side of the bell curve–the DRM aren’t nearly as impactful as they are in the 5 to 9 range. That doesn’t mean you shouldn’t seek them out, just know the risks are not the same.
Hull Down AFV

The left side of table 13 works for Hulldown AFVs but does not account for the special case of a 1,1. If the lowest possible DR to hit is ≥ 3, an Original 2 hits the turret/superstructure rather than the normal hull hit. The odds of hitting a Hulldown target are slightly better than table 13 suggests. The table at left reflects the actual chances (again with the basic TK# of 6 assumed).
I wouldn’t take the time to memorize this or even use it in my pre-game planning. What I would recognize is the odds of hitting a Hulldown target are better than the odds of hitting a target in the turret at a given range.
Deriving Rules of Thumb from Medrow’s Work
Based on everything presented to this point, I offer the following Rules of Thumb for AFV combat based purely on Medrow’s work.
- FIRST RULE OF THUMB: Before the game, identify engagement profiles that mathematically favor your AFV’s capabilities or mitigate your opponent’s strengths.
- SECOND RULE OF THUMB: When a hit is an almost certain kill, the TH DRM is the AFV’s armor.
- THIRD RULE OF THUMB: Not all +1 DRM are equal. The closer to 7, the more impact the DRM has. There are diminishing returns once an Original 4/10 To Hit.
My Original Work – Rate Of Fire
Medrow purposely did not account for Rate of Fire (ROF). There is a complexity there he did not wish to tackle. Medrow tackles it when considering a Hulldown target and suggests a ROF of 3 is like adding 3 to the TK#. A ROF of 2 is like adding a +1 to the TK#. For a ROF 1, the effect isn’t worth considering. Beyond that, Medrow punted on ROF.
For some, this might be enough but for me, this was not satisfying, so I wrote some python code to examine the effects of ROF. I considered an AFV firing at another for 100000 shots. To simplify the situation, the AFV in my simulation stand facing one another until the shooter eliminates the target, or the shooter has taken up to its ROF number in extra shots. For a ROF 3 attack, the shooter takes no more than 4 shots (initial shot + up to 3 ROF shots). For a ROF 1 attack, the shooter does not shoot more than twice.
I am setting the random seed in my python so the output is repeatable for this article. The programmers among you will know what I mean.
Looking At Some Output
| Comparison of ROF – Original TH DR ≤ 5, Original TK DR ≤ 11 (100K shots) | |||
| ROF Number | Kill Rate (w/o) ROF | Kill Rate (w ROF) | ROF Advantage (pct) |
| 1 | 27.0% | 28.68% | 1.68% |
| 2 | 27.36% | 31.9% | 4.54% |
| 3 | 27.09% | 36.33% | 9.24% |
| Comparison of ROF – Original TH DR ≤ 5, Original TK DR < 11 (100K shots) | |||
| ROF Number | Kill Rate (w/o) ROF | Kill Rate (w ROF) | ROF Advantage (pct) |
| 1 | 25.31% | 27.07% | 1.76% |
| 2 | 25.37% | 30.08% | 4.71% |
| 3 | 25.36% | 34.85% | 9.49% |
These two tables are nearly the same, Figure 4 inherits ALL of Medrow’s assumptions while Figure 5 does not. Notice in Figure 4 that the TK is ≤ 11 and not < 11. Figure 4 includes Immobilization and Shock in its Kill Rate calculation. Column 1 in the Figure 4 is very close to Medrow’s 26.6%. Column 1 in Figure 5 is more than 1% less than Medrow’s Table 13 calculation. From this, we can easily see that while the difference between counting “mission kills” with “kills” is definable, it is not necessarily worth concerning ourselves with it for “big picture” rules of thumb.
What is interesting in both tables is that a ROF 3 Gun has a nearly 10% greater chance to eliminate its target than a Gun without ROF. Even when compared to a ROF 1 Gun, a ROF 3 Gun has nearly 8% better chance to eliminate its target. I think this should be intuitively obvious to most ASL players. Also notice the relative improvement remains pretty consistent even when assuming Immobilization/Shock as kills.
Let’s Graph Some Data
Let’s look at a ROF 3 weapon in a different context. In the graph below, I have shown all TK DR between 2 and 12. This graph assumes an Original TH DR of 5 is necessary for a successful hit and a TK# of 11 to eliminate the target. The blue line shows the increased chance of eliminating the target compared to a non-ROF shot of the same TH#. Notice, this scales nearly linearly before flattening off around an 8TH.
From this graph, we determine the effect of ROF 3 levels off around 8TH. After that, the effect is pretty consistent. What might not be apparent from this graph is that the leveling off is heavily influenced by target elimination.
This next graph shows the relationship between a constant 11TK requirement and a random TH DR requirement. This graph uses a random TH DR and a constant 11TK. Taken together, this depicts the chances of killing an AFV under those conditions.
This continues to be a ROF 3 weapon. This shows that the TK chance steadily improves until about an Original TH 6. The improvement then levels off between an Original TH 7 and Original TH 8, before basically flat-lining through 12. So once again, not all TH DRM are going to be equal. Reducing the chance of a hit will certainly reduce the chances of a TK, but when your opponent’s TK# is high, your best chances to change the odds are in the Original 4 – 8 TH DR range.
Deriving Conclusions From These Graphs
It should also be obvious, the kill rate improvement flat lines at the tail of the distribution because the target is eliminated fairly often. AFVs will not survive standing in front of a high ROF weapon with a high TK#.
What might not be as obvious from these two graphs though is this: if sitting in front of a Gun with an almost certain kill on hit, there is little sense in trying to get away if you can’t push the Original TH DR to < 8. You could do this by getting a SMOKE Dispenser and going into Motion against a Point Blank shooter.
- FOURTH RULE OF THUMB: AFVs will not survive front of high ROF weapons with high TK#s.
- FIFTH RULE OF THUMB: At mid- and upper-range TH#s, an AFV is VERY unlikely to withstand a second TK attempt if the TK is ≥ 8.
3D Graphing All TH/TK Possibilities
ROF 1

Having seen the last two graphs, let’s look at ALL TH/TK ranges for each of the ROF chances and see what the ROF advantage in Kill Rate looks like. These graphs will be 3D. They do not consider Immobilization and Shock as kills. They show the number of shots taken and acknowledge the number of Shock/Immobilizations (“Mission Kills”) and Possible Shocks scored across the 100K shots.
Each graph shows all shots for a particular rate of fire. These graphs also account for Duds (C7.35). I continue to limit the number of ROF shots to the Rate of the shooter (a ROF 1 attack can have no more than 2 shots, a ROF 3 attack can have no more than 4 shots).
ROF 2
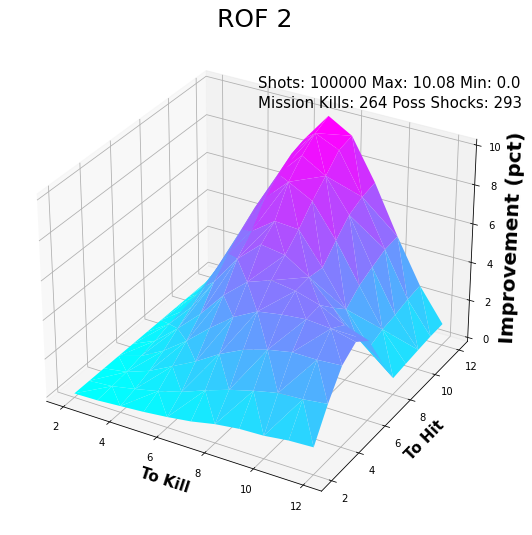
Pay attention to the z-axis (the vertical). It displays the increased lethality of a ROF weapon compared to a weapon with no ROF. Notice that for each ROF, the scale on the z-axis is different, reflecting the increased lethality of ROF. For a ROF 1 weapon, the largest increase in lethality is 4.46% around 7TH and 12 TK. The lethality drops off from there fairly uniform. There is one anomaly which we will talk about shortly.
ROF 3
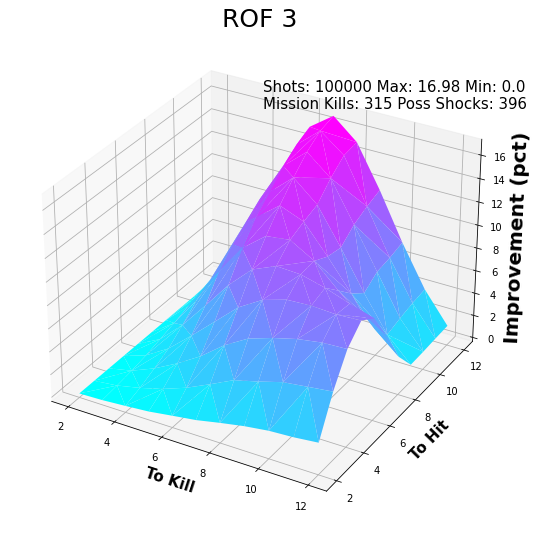
Looking at the ROF 2 and ROF graphs, we see the same behavior with a different scale in the z-axis. For a ROF 2 weapon, the greatest change is 10.08% around 7TH and 12 TK. The improvement is 16.8% on for ROF 3, again peaking at 7TH and 12 TK.
Look more closely at each of these graphs. Notice how there seems to be no “improvement” for high probabilities TH and high probabilities to TK. This makes sense as the first shot hits and eliminate the target. There is no improvement on this.
Notice that “hump” along the 11 TK line? This is a rendering of the Flat TK vs. ROF graph in 3D. This same “hump” exists until about 8 TK. It disappears at around 10 TK. Each graph exhibits this same characteristic.
Deriving Rules From The 3D graphs
From Figures 6 through 8, we can determine additional rules of thumb:
- SIXTH RULE OF THUMB: Armor is most effective up to about 7 TK. If your Armor Factor combined with his Modified TK# yields a Final TK# of 7 TK or less, you can reasonably rely on your armor to save your AFV from a hit. You will still lose AFV, but most will survive.
- SEVENTH RULE OF THUMB: Impose Conditional ROF on your opponent when you can to improve your chances.
The seventh rule is also an example of a compounding improvement for the ATTACKER. The general reason for Conditional ROF is because a unit is shooting out of a Woods/Building Location and needs to change CA. Such a change will also lock the weapon’s CA for the rest of the current fire phase and may free up other opportunities for you to exploit.
Base Graph For Comparison

This graph shows a ROF 0 weapon. It does account for Duds. It also separates out the mission kills. I include it for comparison. You can use this as a means for thinking about DRM and how they are not all created equal. Moving a TH or TK out of the purple and into the dark blue is more effective than moving from purple to purple. Moving from the dark blue into the light blue is less effective even if still worth considering.
Additional Rules From Hard Won Experience
In no particular order, I offer these final thoughts on AFV combat:
- Work the numbers for a Bounding First Fire Shot out before the game. New players underestimate the odds of eliminating a target with a Bounding First Fire attack.
- You can’t hit what you can’t see. Only expose your AFV to incoming fire if you are reasonably certain you will get a chance to shoot back (first or second).
- As the defender, you should ALWAYS shoot first. If you are not, you’re doing something wrong.
- As the Attacker, your chance to eliminate his AFV should be reasonably close to his chance to eliminate yours unless you are looking for SMOKE to cover the attack.
Conclusion
I know this article covered some fairly intensive math. I tried to keep it to a minimum and to focus on only the graphs in Medrow’s article, or which I produced myself. Hopefully, this makes the article a little easier to read compared to the original.
I don’t claim to be a math wizard. I am sure someone could do all the work in Excel by a spreadsheet genius. If that’s you and you are looking for some place to host it, reach out and let me know. I will do it or I will see if I can talk Sam Tyson to host it on the Texas ASL site.
If you have questions, reach out. If you have other suggestions for modeling, let me know those too. I am already considering a model which depicts “n” AFV against a “beast” to see if I can sort out the “correct” number of AFV to take on a Panther, the classic Dance o’ Death situation. We’ll see if I can sort out all the TCA/VCA changes, MG options, ROF, etc. I am not sure it’s possible but I may certainly try. Until next time. – jim

Bob Medrow was my first, and for a long time only, SL/ASL opponent. Playing him was like East Toadsuck State playing Alabama. But I enjoyed the play and I learned. He’s a professor of engineering and can do the math in his head at, well, the speed of thought. I can do addition on a calculator!
I wish I had met him. He is sort of an ASL hero to me. I have read all of his articles many times over. As I said above, they truly are the best ASL articles ever written IMO.
I have some follow on work I am sitting on extending Bob’s earlier work on OBA. I probably won’t release that until sometime next year. Thanks for commenting. I can’t tell you how much it means to me. — jim